Brain Neural Connectome Analysis
Sponsored by University of St. Thomas Graduate Programs in Software, School of Engineering
In-Memory Analysis of Brain Connectivity Graphs
Supported by Amazon Cloud Computing Research Grant 2015/2016
Project Mission: Make analytic results of brain connectome networks publically available on the Amazon Cloud!
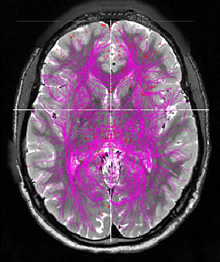
The Human Connectome Project (HCP) [1] recently released functional MRIs (fMRIs) of 500 subjects; each includes a resting state fMRI and seven task fMRIs. Analyzing those 4000 dense brain connectome networks with total of multi-trillion links is a challenging topic in computational neuroscience. Yet, it also offers an opportunity for neuroscientists to understand the complex relationships between the structure and the functionality of the human brains [5]. Unfortunately, graph analysis is computational expensive because many graph algorithms are NP problems. Analyzing big and very dense graphs like brain connectivity networks is even more forbidding for many neuroscientists due to the lack of adequate computing resources.
Heavily distributed disk-based systems, like Hadoop, offer a possible solution by mapping large amount of graph vertices and links across many interconnected computing nodes with small memory. However, maintaining global data structures required by many graph algorithms (i.e. a global priority queue in the Dijkstra's algorithm) over a heavily distributed system is not easy. In fact, substantial amount of network communications needs to be exchanged among physically separated systems to allocate the neighborhood information of each graph vertex in large dense graphs (see Chapter 5.4 in [4]) like brain connectivity graphs. The long latency of substantial network communications can lead to significantly under-utilized computing resources.
The in-memory processing paradigm, in contrast, stores a significant portion of the neighborhood information of graph vertices in local memory and cache. Since data access from local memory is at least thousand times faster than accessing data through disk I/O or network communication, in-memory processing with fewer CPUs may achieve equal or even better performance than heavily distributed systems with a massive amount of CPUs [6, 7]. Additionally, synchronizing concurrent tasks in a high-speed local memory via semaphore is much easier and more efficient than via the asynchronous mechanism of exchanging high-latency network messages. Figure 1 illustrates the differences in graph analysis under two different computing paradigms.
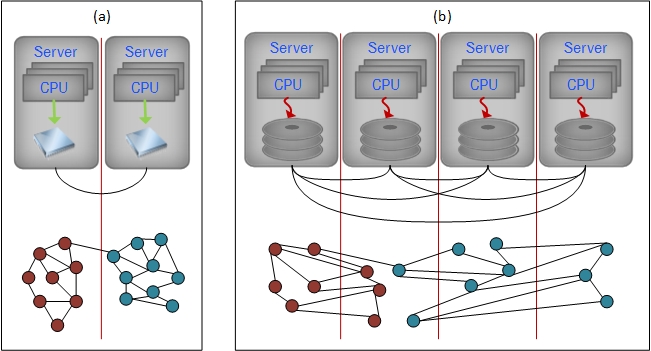
Figure 1.
(a) Large “in-memory” systems stores significant graph neighborhood in fast local memory with light-weight network communications. (b) Highly distributed system requires substantial network communications and disk I/O to allocate graph neighborhood information.
To avoid communication overhead which can lead to under-utilized CPUs, we plan to rely on the in-memory paradigm to analyze dense brain connectivity graphs. Since studies in [6, 7] suggested that the in-memory paradigm with fewer CPUs may achieve equal or better performance than the heavily distributed system, we plan to use very few AWS instances that supply large memory capacity. More specifically, we plan to use Parallel Matlab or GraphX on Spark [7] to measure various graph characteristics (i.e. betweenness, clustering coefficient) from big graphs stored in large memory of few AWS instances. The ideal AWS instances type for this purpose is r3.8xlarge because of its 244GB memory.
After measuring various graph characteristics of the brain connectivity graphs extracted from different task fMRIs of different subjects, we plan to store all those measurements in the SAP HANA (High-performance Analytic Appliances) in-memory database for further query and pattern analysis. We choose SAP HANA not only because it supports high-speed real-time queries, but also because it provides a comprehensive set of data mining algorithms that are highly parallelized. As a result, the SAP HANA in-memory database can seamlessly exchange real-time analysis results to and from Parallel Matlab or GraphX on Spark running on other in-memory AWS instances. Since SAP HANA was designed to work on compressed data that is about 1/10 of original data size[2][3], it can handle data close to 600 GB on an m2.4xlarge AWS instance with 64GB of memory. Figure 2 illustrates the workflow between different systems running on different AWS instances.
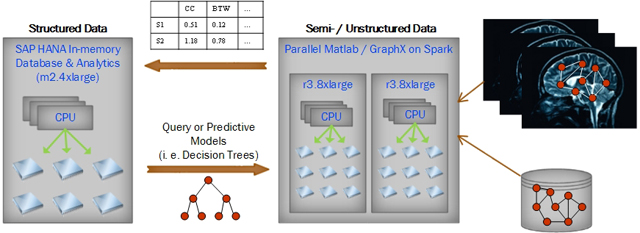
Figure 2.
Parallel Matlab and GraphX first extract graph features from the unstructured MRI data and the semi-structured graph data. Graph features are then stored on SAP HANA in-memory database for further pattern analysis from HANA’s Predictive Analytics Library. Patterns are supplied back to extract higher quality of graph features.
We strongly believe that we can expedite our understanding of brain functionality and help patients with various neurological conditions if we can remove cumbersome hardware setup procedures and simplify steps in analyzing brain connectivity graphs. Hence, we are committed to disseminate and share our research results with other researchers in this area. In fact, our long-term goal is to evolve our project into a cloud-based service so that neuroscientists can analyze different brain connectivity graphs from subjects with different neurological conditions using our graph analysis system, and compare features extracted from their graphs against the features of other brain connectivity graphs stored in our HANA in-memory database.
We estimate that our project will be a year-long project. We divide our project into the following three major phases:
Preliminary experiment: We expect the preliminary analysis results around March 2015.
Major development: Substantial amount of graph analysis results will be ready by the end of summer in 2015.
Enhancement: Final improvement to our system will be accomplished by the end of 2015.
EC2 Usage
As we discussed above, we need two to three r3.8xlarge instances for extract graph features from big brain connectivity graphs with billions of graph edges. Another three to four m2.4xlarge instances will be used for running SAP HANA predictive analysis of graph features. Please see the attached estimated usage and cost generated from Amazon Calculator.
Acknowledgements
Data was provided by the Human Connectome Project, WU-Minn Consortium (Principal Investigators: David Van Essen and Kamil Ugurbil; 1U54MH091657) funded by the 16 NIH Institutes and Centers that support the NIH Blueprint for Neuroscience Research; and by the McDonnell Center for Systems Neuroscience at Washington University. Many thanks go to our Web Manager, Kathleen Hauser, for her help in creating this web site.
References
[1] The Human Connectome Project, WU-Minn Consortium, humanconnectome.org.
[2] SAP AG, “SAP HANA Platform – Technical Overview”, https://archive.sap.com/documents/docs/DOC-60354, 2012.
[3] SAP AG, “SAP HANA Performance – Efficient Speed and Scale-out for Real-time BI”, 2012.
[4] Jimmy Lin, Chris Dyer. “Data-intensive Text Processing with MapReduce”. San Rafael: Morgan & Claypool, 2010.
[5] J. Ommen, C. Lai, Y. Yang, “Big Graph Analytics of Human Connectome Networks” (Abstract), SIAM Conference on Computational Science and Engineering, Salt Lake City, UT, 2015.
[6] Robert Klopp, “Five Minute Rule and HANA blog post”, https://web.archive.org/web/20210128041509/https://blogs.saphana.com/2012/09/17/the-five-minute-rule-and-hana/, 2012.
[7] Matei Zaharia, et. al., “Resilient distributed datasets: a fault-tolerant abstraction for in-memory cluster computing”, 9th USENIX conference on Networked Systems Design and Implementation, 2012.